Predicting the future is difficult, to put it mildly. Try as we might, most attempts at predicting what's to come have historically been fraught. Sure, Nostradamus almost got one right when he predicted the rise of Charles de Gaulle, and de Tocqueville foresaw a coming rivalry between the United States and Russia in the first volume of his 1835 book Democracy in America. But correct predictions—or shall we say correct as well as precise predictions, which neither Nostradamus’s nor de Tocqueville’s were—are much more rare.
More memorable in the fields of forecasting are the outright misses, like the Chicago Daily Tribune’s infamous “Dewey Defeats Truman” headline. Or to cite a more recent example, there’s the 2016 U.S. presidential election, when nearly everyone forecasting the race—including the typically reliable FiveThirtyEight (who gave Republican candidate Donald J. Trump a 28.6 percent chance of winning)—called it for Hilary Clinton.
Nonetheless, the complex work underpinning scientific data analysis has led to increasingly nuanced—and increasingly reliable—predictions (or estimates, to use a more accurate term for this context). Making quantitative predictions of the future state of anything—from COVID-19 deaths, to where the next hurricane will make landfall—requires first and foremost a "model," which is basically just an equation or set of equations that describe the phenomena you wish to capture.
Predicting the future, 'Ain't what it used to be'
Yogi Berra
Over the years, the "models" of infectious diseases have been refined. The SIR (susceptible, infectious, recovered) compartmental model was created in the 1920s, describing human populations in three buckets—those who have, have had, or have not had the disease. Since then, a number of more elaborate compartmental models have been devised, including the SEIR (susceptible, exposed, infectious, resistant), SEIS (susceptible, exposed, infectious, susceptible), MSEIR (where M describes maternally-derived immune individuals), and MSEIS models. Examples of model use abound, but an illustrative non-COVID-19 example is a study published in Public Health that used an SIR model to estimate the transmissibility of hand, foot, and mouth disease.

To borrow from Yogi Berra, predicting the future “ain’t what it used to be.” But that doesn’t mean that all estimates are created equal, or that reliable estimates are by definition absolute. See, in addition to the right model, the other thing needed to make estimates is data. Models are mathematical equations that reflect underlying phenomena, but to use models to predict the future you have to have good data on the present to plug into them. And that's where uncertainty comes in.
What is uncertainty?
To be clear, we’re referring to statistical uncertainty, the textbook definition of which is a “parameter, associated with the result of a measurement, that characterizes the dispersion of the values that could reasonably be attributed” to that measurement, per the International Organization for Standardization. In layman’s terms, uncertainty is a form of hedging. It’s making an educated guess that involves a range of related guesses.
Uncertainty is 'a quantification of what's left over once you correct all the human errors'
Physicist Chad Orzel
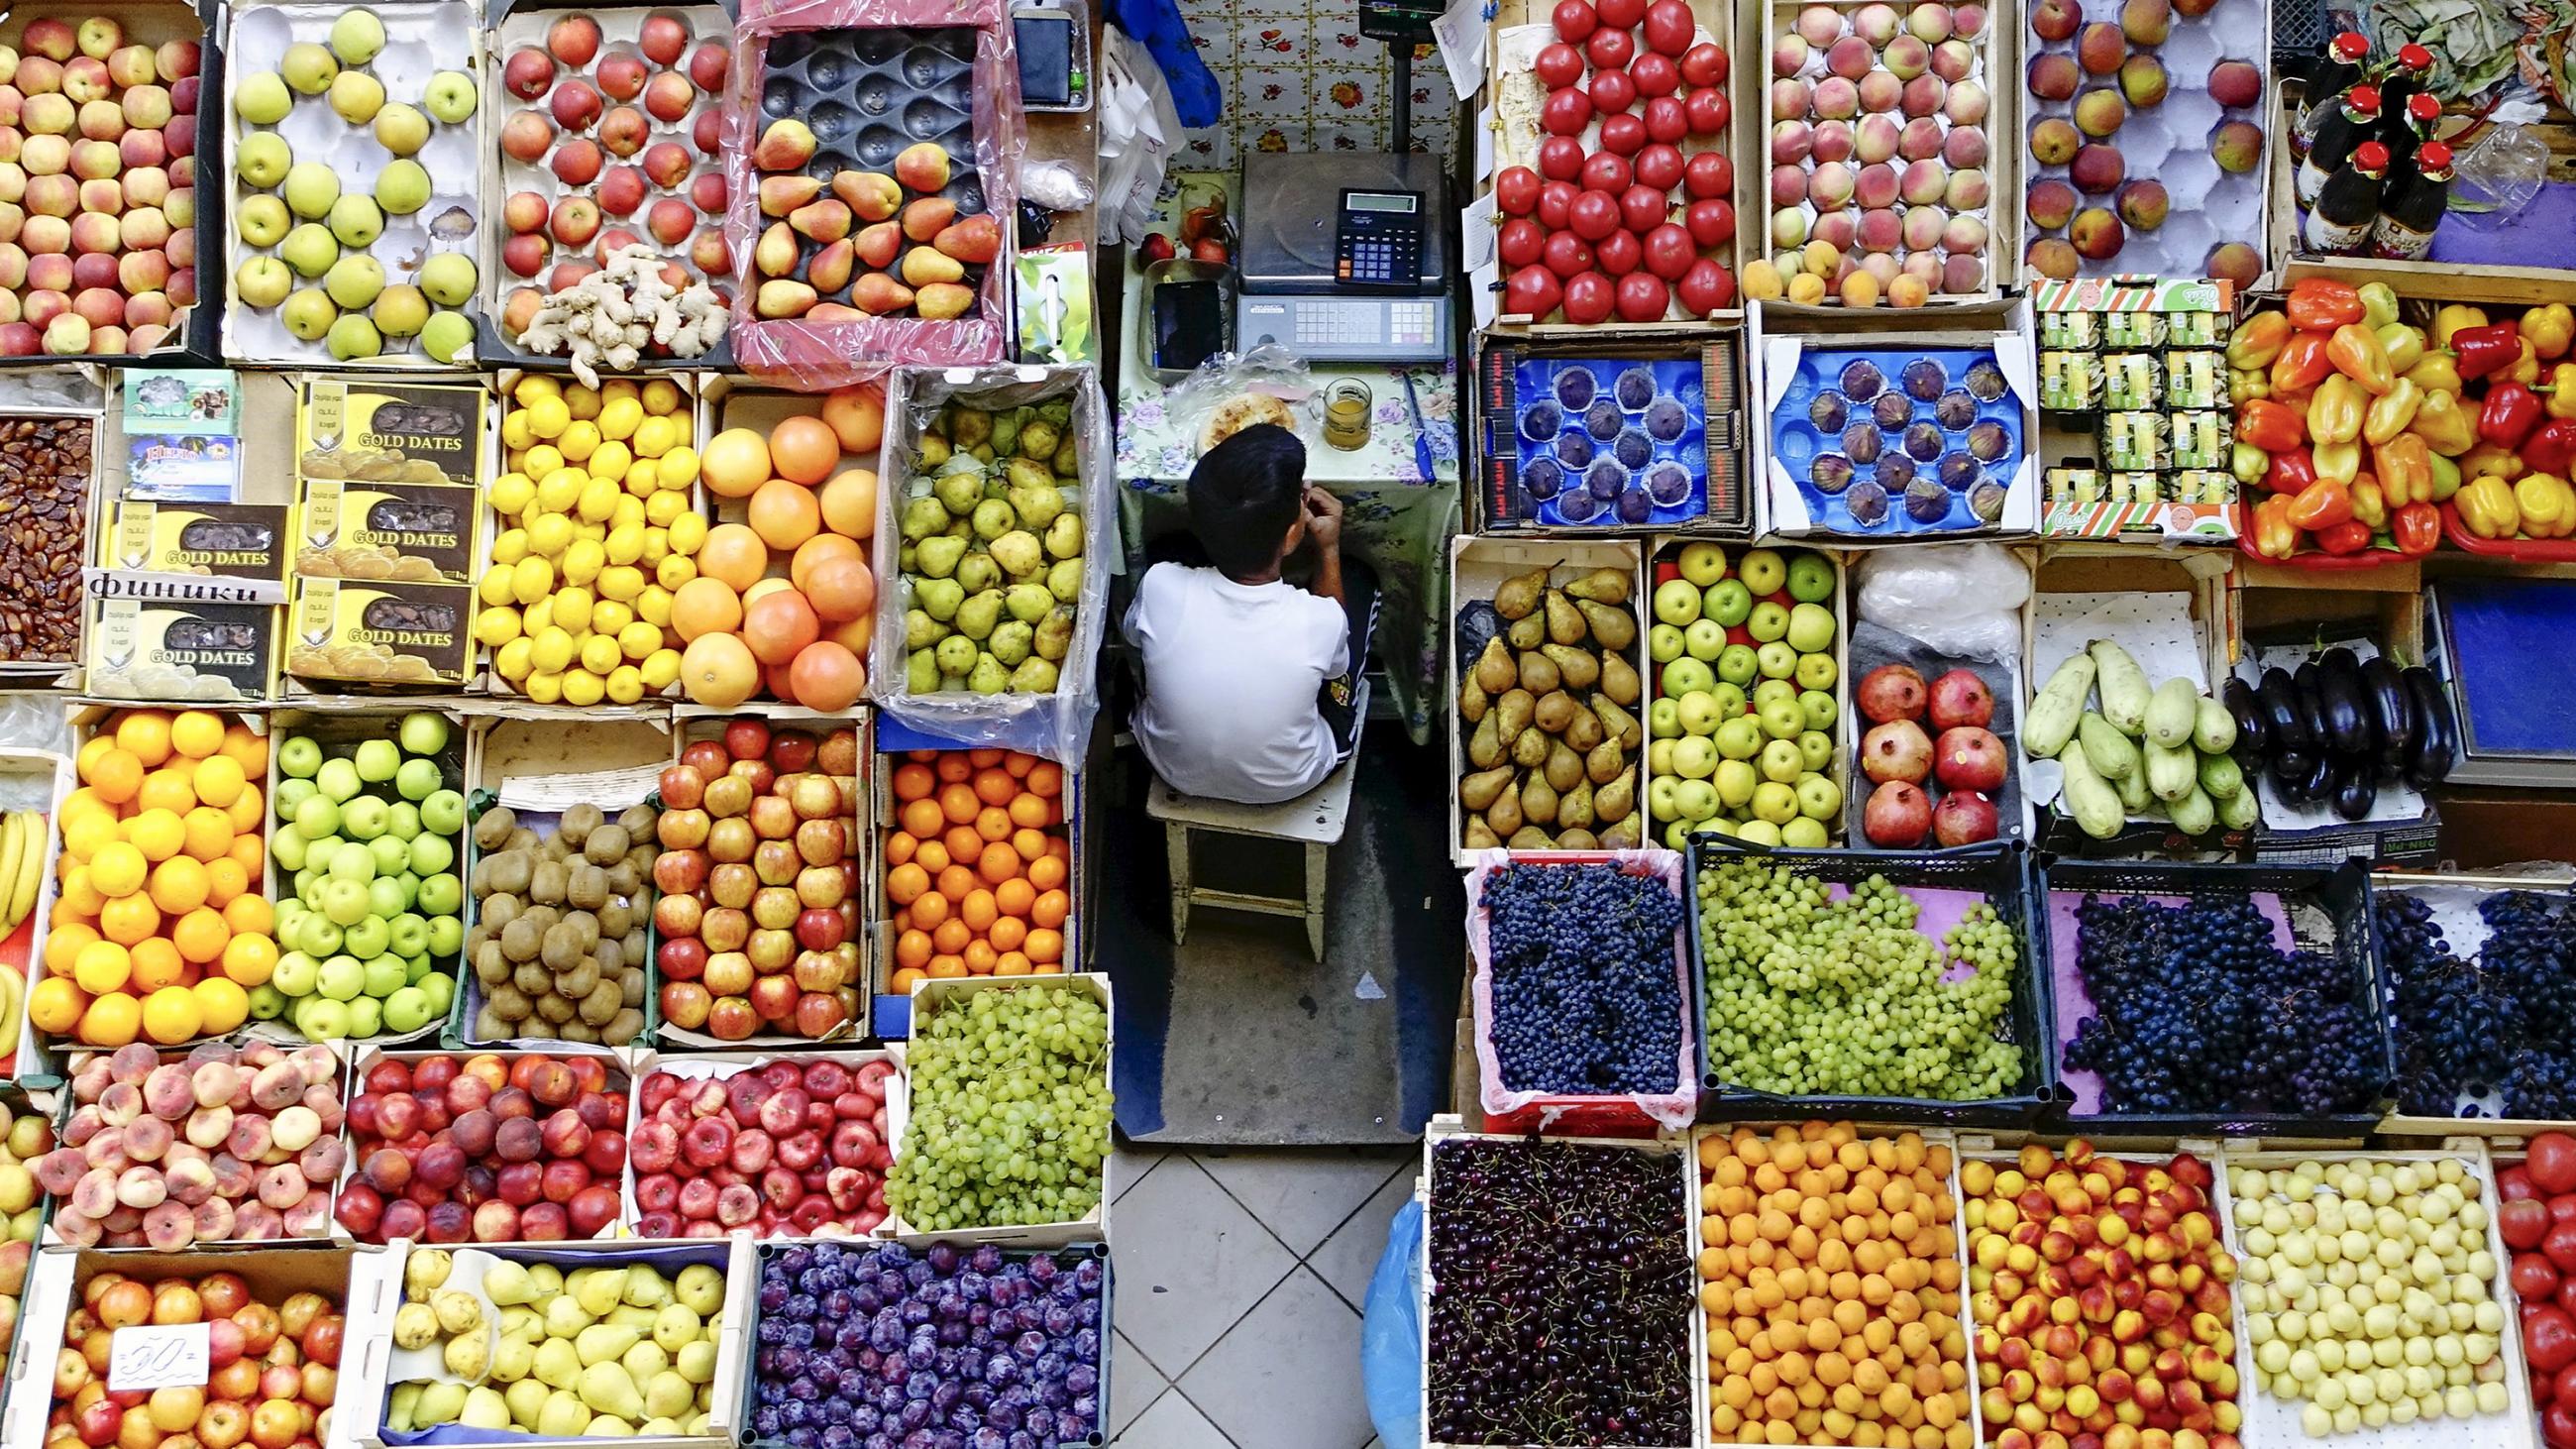
Here’s a simple example to illustrate the concept. Instead of stating, “I estimate that you’ll be given exactly three apples at the fruit stand tomorrow,” when accounting for uncertainty one would say something more like, “I estimate you’ll be given one to five apples (with the median being three, the point at which it’s equally likely for the estimate to be above or below) at the fruit stand tomorrow.” That prediction takes prior knowledge and reasonable assumptions into account: that you’re going to the fruit stand tomorrow; that the owner likes you; that you like apples; and that just as you’ve received free apples in the past you will again tomorrow. That's basically all a prediction is—a reasonable estimate with a degree of uncertainty. The uncertainty in an estimate allows for the things you don’t or can’t know, or if any of your assumptions prove incorrect or overconfident.
Another way of putting it is how the physicist Chad Orzel did in his own piece on the topic: uncertainty is “a quantification of what's left over once you correct all the human errors. It's saying ‘while we are unable to perfectly control everything in the universe, we know that the uncontrolled effects can't be any bigger than this.’”
There’s a huge responsibility that comes with modeling something like the impact of COVID-19 on health systems and populations
However, just because our ability to estimate with precision has increased, that does not mean estimates won’t fall within broad ranges of results. Nonetheless, there’s a huge responsibility that comes with modeling something like the impact of COVID-19 on health systems and populations, and everyone involved wants to get the numbers right—or as close to right as is possible. This often means that projections are subject to revision. Take the COVID-19 estimates from the Institute for Health Metrics and Evaluation (IHME), which have received wide media and government attention, plus a fair amount of criticism. Below are a number of IHME’s estimates by date, of overall U.S. deaths until August 2020. The first number is IHME’s estimate and the numbers in parentheses are the intervals those estimates fall in.
As a technical side note, some of these ranges are admittedly broad (April 2 and April 10’s, for example). And IHME’s model was expanded to a more complex framework—from a curve-fitting exercise intended to predict hospital resource needs to a hybrid model that included an SEIR component—on May 4, hence the large jump between then and the prior week. Even taking the May update into account, it’s worth pointing out that the May 26 estimate still falls within the range of the March 30 update, even as the range of numbers the model has been predicting shifted upwards.
Statistical uncertainty can also be problematic for readers because it can give numbers the appearance of being difficult to depend upon
One of the problems that the chart above illustrates is that uncertainty is slippery. Not only can uncertainty make for very different outcomes, it can be hard to consider simultaneously whatever the most likely outcome is (the “main” estimate) while also keeping in mind the range of numbers that the main estimate falls in. And at a basic level, the above is a list of deaths in the tens and hundreds of thousands, which is deeply sobering, not to mention hard to fathom. All of which can almost lead to a sort of mild numerophobia—the fear or distaste of engaging with numbers—on the part of readers. Statistical uncertainty can also be problematic for readers because it can give numbers the appearance of being difficult to depend upon. To return to the apple example: because of what I know about your day tomorrow, I estimate that you’ll receive three apples. But you could get anywhere from one to five apples. The difference between your receiving one apple (a nice snack) and five apples (enough to bake a delicious apple pie) is wide.
So when it comes to the difficult job of estimating a disease’s impact in order to craft a response to that disease, if plans rely on specific estimates instead of the entire range of numbers an estimate falls in, then any fluctuation in actual outcomes can profoundly affect those plans. If decision-makers rely on precise estimates to allocate hospital resources, for example, then getting the numbers wrong (or, conversely, misreading what a range of numbers might be suggesting) can have grave consequences. That can be discomfiting, but it also can’t be avoided, because uncertainty is inherent to estimating.
The more we learn about how the virus spreads—and how effective strategies to mitigate COVID-19 have been—the better we can estimate its impact
Complicating matters further, estimation in general is a constantly iterative process. Proving this point is how estimates of deaths from COVID-19 have run the gamut. Early predictions of the pandemic’s impact on the United States ranged from Imperial College London’s original estimate of 2.2 million deaths from “an unmitigated epidemic” to IHME’s first U.S. projection on March 26, which estimated 81,114 deaths (with a range of 38,242 to 162,106) by July 2020. Since the beginning of the pandemic, a number of other models have been released, including work from the Los Alamos National Laboratory, the Massachusetts Institute of Technology, and by the independent scientist Youyang Gu. According to FiveThirtyEight’s COVID-19 forecast tracker, while the different models showed a range of results through April, the various estimates have largely converged as the pandemic has progressed. This convergence illustrates a broad improvement in the modeling strategies employed across groups, as well as COVID-19 data available to researchers.

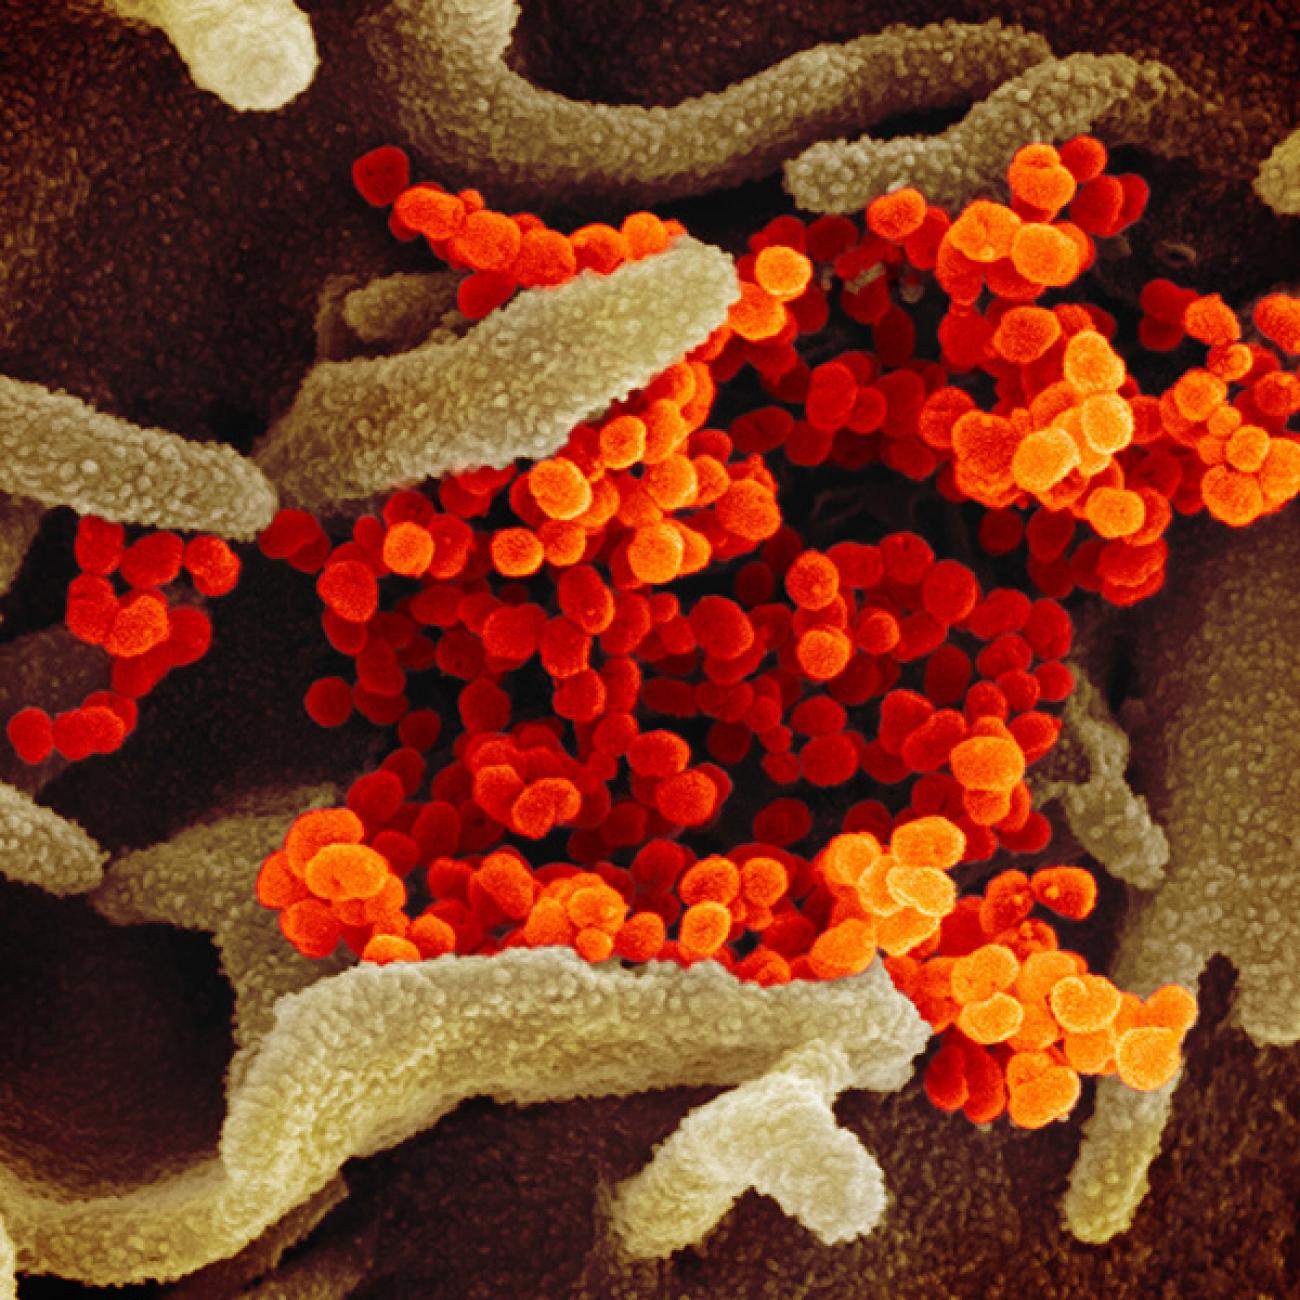
It’s worth pointing out how new COVID-19 still is: SARS-CoV-2, which causes the disease, is a novel virus, and the pandemic’s length can still be measured in months, not years. With COVID-19, we see broad uncertainty because the pandemic has been a rapidly evolving situation. And the more we learn about how the virus spreads—and how effective strategies to mitigate COVID-19 have been—the better we can estimate its impact. Indeed, per a COVID-19 timeline put together by the World Health Organization, a cluster of pneumonia cases was first reported by the Wuhan Municipal Health Commission on December 31, 2019. And the first U.S. case only surfaced in mid-January 2020.
A possible alternative to acknowledging uncertainty is false certainty, and with it the chance of getting something very wrong
Ultimately (and frustratingly), the whole topic of estimation and uncertainty is fraught with difficulty, and it presents huge cognitive and philosophical challenges. And the more we know—the more data we have, and the more inputs go into a model—the greater the possibility of uncertainty. But a possible alternative to acknowledging uncertainty is false certainty, and with it the chance of getting something very wrong.

EDITOR'S NOTE: The authors are employed by the University of Washington’s Institute for Health Metrics and Evaluation (IHME), which produced the COVID-19 forecasts described in this article. IHME collaborates with the Council on Foreign Relations on Think Global Health. All statements and views expressed in this article are solely those of the individual authors and are not necessarily shared by their institution.