The differences in U.S. life expectancy are so large it's as if the population lives in separate Americas instead of one.
Nearly two decades ago, a team of researchers published the landmark "Eight Americas" study, which examined drivers of U.S. health inequities between 1982 and 2001 by dividing the U.S. population into groups based on geography, race, income, and other factors.
A new research study, published this month by the University of Washington and the Council on Foreign Relations, revisits that landmark research project, adding two new "Americas" to account for Latino populations.
This new study finds that U.S. life expectancy disparities have grown over the last two decades between 2001 and 2021, with the differences between the best and worst of those "Americas" increasing from 12.6 years in 2000 to 20.4 years in 2021. COVID-19 exacerbated this divide, but gaps in longevity had already been growing before the pandemic hit.
- The life expectancy of Asian Americans has steadily improved since 2001 to an average of 84.0—the highest life expectancy of all the "Americas."
- American Indian and Alaska Natives (AIAN) in the western United States experienced the greatest decline in life expectancy before COVID-19 and the largest drop in longevity after the pandemic began. Their average life expectancy—63.6 years—is more than two decades shorter than for Asian Americans. For comparison, that is the same difference that existed between the average life expectancy in Afghanistan (63.0 years) and Japan (84.0 years) in 2022.
- The average life expectancy of white Americans in low-income counties in Appalachia and the lower Mississippi Valley has not increased in two decades. Their average longevity (71.8 years) fell during the pandemic and has been slow to recover since.
- Latino Americans, despite having lower incomes than many white Americans, have had higher life expectancy on average. However, Latino Americans in the southwestern United States have notably lower life expectancy (80.4 years) than Latino Americans elsewhere (83.0 years).
- The gap between Black and white Americans had shrunk and may never have been narrower in U.S. history than it was in the mid-2010s, but progress began to stall in the five years prior to the pandemic and started to reverse after the emergence of COVID-19.
Although U.S. health inequities had been growing since the mid-2010s, that trend accelerated with the emergence of COVID-19. The largest declines in U.S. life expectancy during the first year of the pandemic were suffered by AIAN, Black, and Latino Americans. Essential workers in the pandemic were disproportionately AIAN, Black, and Latino. These population groups were more likely to live in multigenerational households, where SARS-CoV-2 spread more easily, and were more likely to face discrimination and systemic disadvantages in accessing health care. Only a quarter of U.S. states included specific strategies to encourage vaccination in minority racial and ethnic communities in their initial COVID-19 vaccine rollout plans, despite previous research showing those communities have historical reasons to mistrust public health campaigns.
The Pandemic Hit Some Groups Harder Than Others
American Indians and Alaska Natives experienced the greatest drop in life expectancy during COVID-19
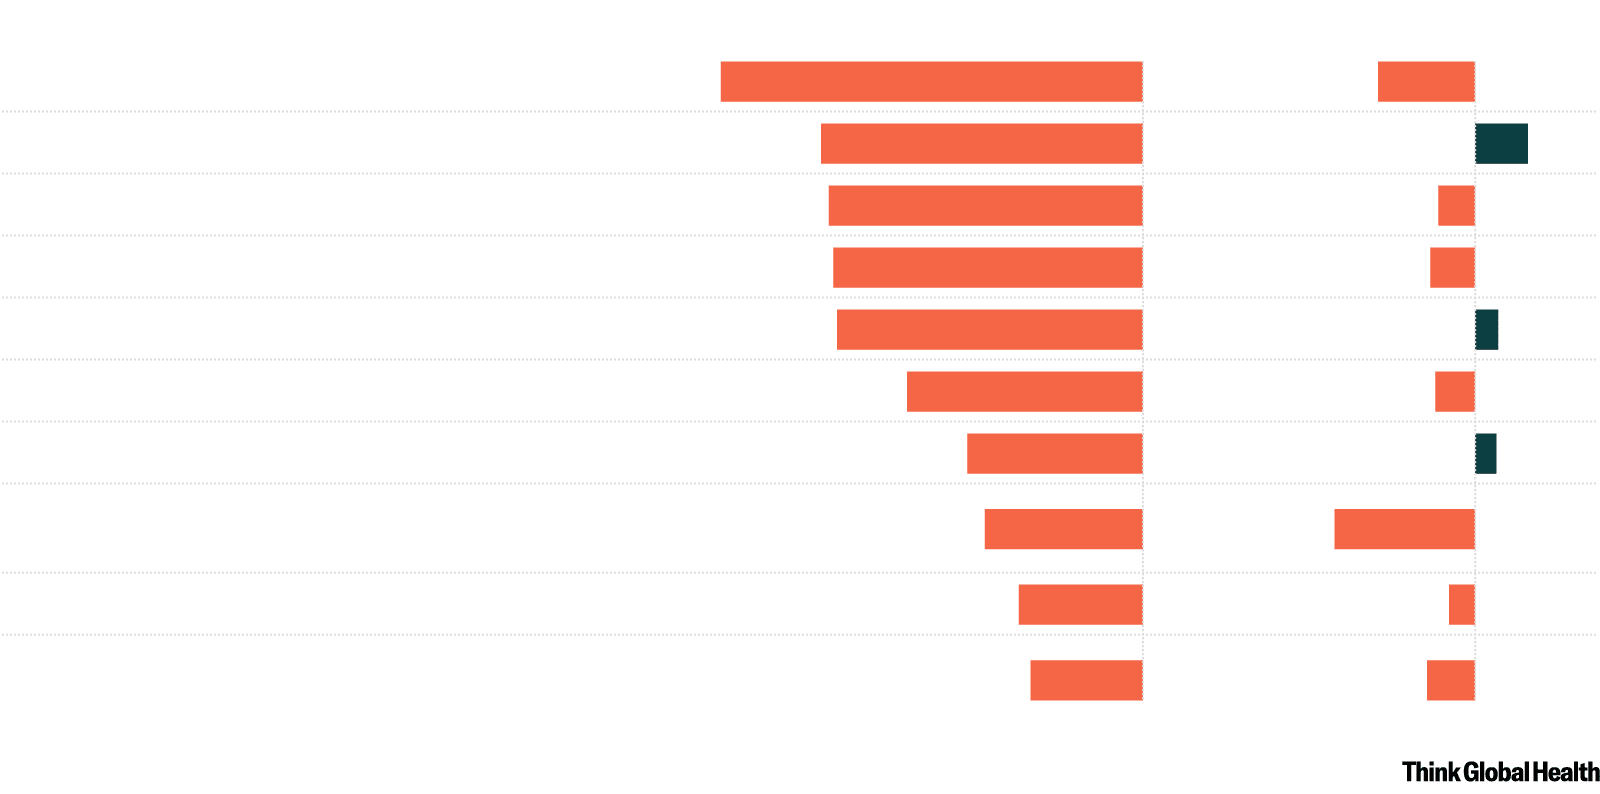
2019-2020
2020-2021
American Indians and Alaska Natives in the West
−5.3
−1.2
Black in highly segregated metro areas
−4.1
0.7
Black in nonmetro areas and low-income South
−4.0
−0.5
Latino in the Southwest
−3.9
−0.6
Latino in other counties
−3.9
0.3
Black in other counties
−3.0
−0.5
Asian
−2.2
0.3
White in low-income Appalachia and lower
−2.0
−1.8
Mississippi Valley
White in nonmetro areas and low-income North
−1.6
−0.3
White, Asian, American Indians and Alaska Natives
−1.4
−0.6
in other counties
Chart: CFR/Allison Krugman • Source: Dwyer-Lindgren et al., The Lancet 404 (2024): 10469

2019-2020
2020-2021
American Indians
and Alaska Natives
−5.3
−1.2
in the West
Black in highly
segregated metro
−4.1
0.7
areas
Black in nonmetro
areas and low-
−4.0
−0.5
income South
Latino in the
−3.9
−0.6
Southwest
Latino in other
−3.9
0.3
counties
Black in other
−3.0
−0.5
counties
Asian
−2.2
0.3
White in low-
income Appalachia
−2.0
−1.8
and lower
Mississippi Valley
White in nonmetro
areas and low-
−1.6
−0.3
income North
White, Asian,
American Indians
−1.4
−0.6
and Alaska Natives
in other counties
Chart: CFR/Allison Krugman
Source: Dwyer-Lindgren et al.,
The Lancet 404 (2024): 10469
In the second year of the pandemic, from 2021 to 2022, the health of many Americans rebounded with the arrival of effective vaccines. But some groups have still not recovered, especially the AIAN population living in the western United States and low-income Black and white Americans in the South.
The growing extent and magnitude of health disparities in the United States is truly alarming. This research reveals that poor U.S. health is not determined by singular characteristics—age, income, race, or environment—but by their combined interactive effect.
The growing extent and magnitude of health disparities in the United States is truly alarming
In particular, the declining health of the AIAN population, especially in the western United States, is a crisis. Lower rates of health insurance and chronic underfunding of the Indian Health Service are barriers to the AIAN people in this region accessing health care. Higher rates of unemployment, lower rates of educational attainment, and a devastating history of discrimination against AIAN people and cultures have contributed to higher rates of excessive alcohol consumption, tobacco use, and poor diet. Simply, AIAN voices and needs must play a greater role in U.S. political debates over health. Improvements in education and employment opportunities will likewise be essential to alleviating health disparities and fostering socioeconomic growth for AIAN communities.
The decline in national U.S. life expectancy is not intractable. The "Ten Americas" study and those like it demonstrate that localized planning, national prioritization, and greater resource allocation is possible. Policymakers and politicians must target the needs of the most disadvantaged so that all Americans can live long, healthy lives, regardless of where they reside, their race, or their income.

EDITOR'S NOTE: This article was originally published as an interactive on CFR.org.
